A reporting automation pipeline I designed to move teams away from repeated manual preparation and toward validated, scheduled, reusable reporting data that can feed dashboards, scorecards and exports.
40hrsWeekly reporting effort represented as automation opportunity.
QAQuality gates for validation, quarantine and monitoring.
MartClean reporting layer prepared for dashboards and exports.
ScaleReusable pattern for recurring reports across teams.
The Business Problem
Recurring reporting often depends on manual extracts, spreadsheet preparation, copy-paste transformations and analyst memory. The process may work for one report, but it becomes fragile when the number of sources, users, schedules and exceptions grows.
The business risk is not only wasted time. It is inconsistent metrics, late reporting, weak auditability and dashboards that people do not fully trust.
The question was how to make reporting data refreshable, testable and reusable without turning this public demo into a heavy engineering platform.
What I Built
I built an ETL and reporting-pipeline concept that extracts data from multiple systems, validates incoming records, quarantines bad rows, applies business transformations and publishes a clean reporting mart.
The demo makes the pipeline visible: users can inspect source records, validation stages, rejected rows, transformation output and the final reporting dataset.
Solution Architecture
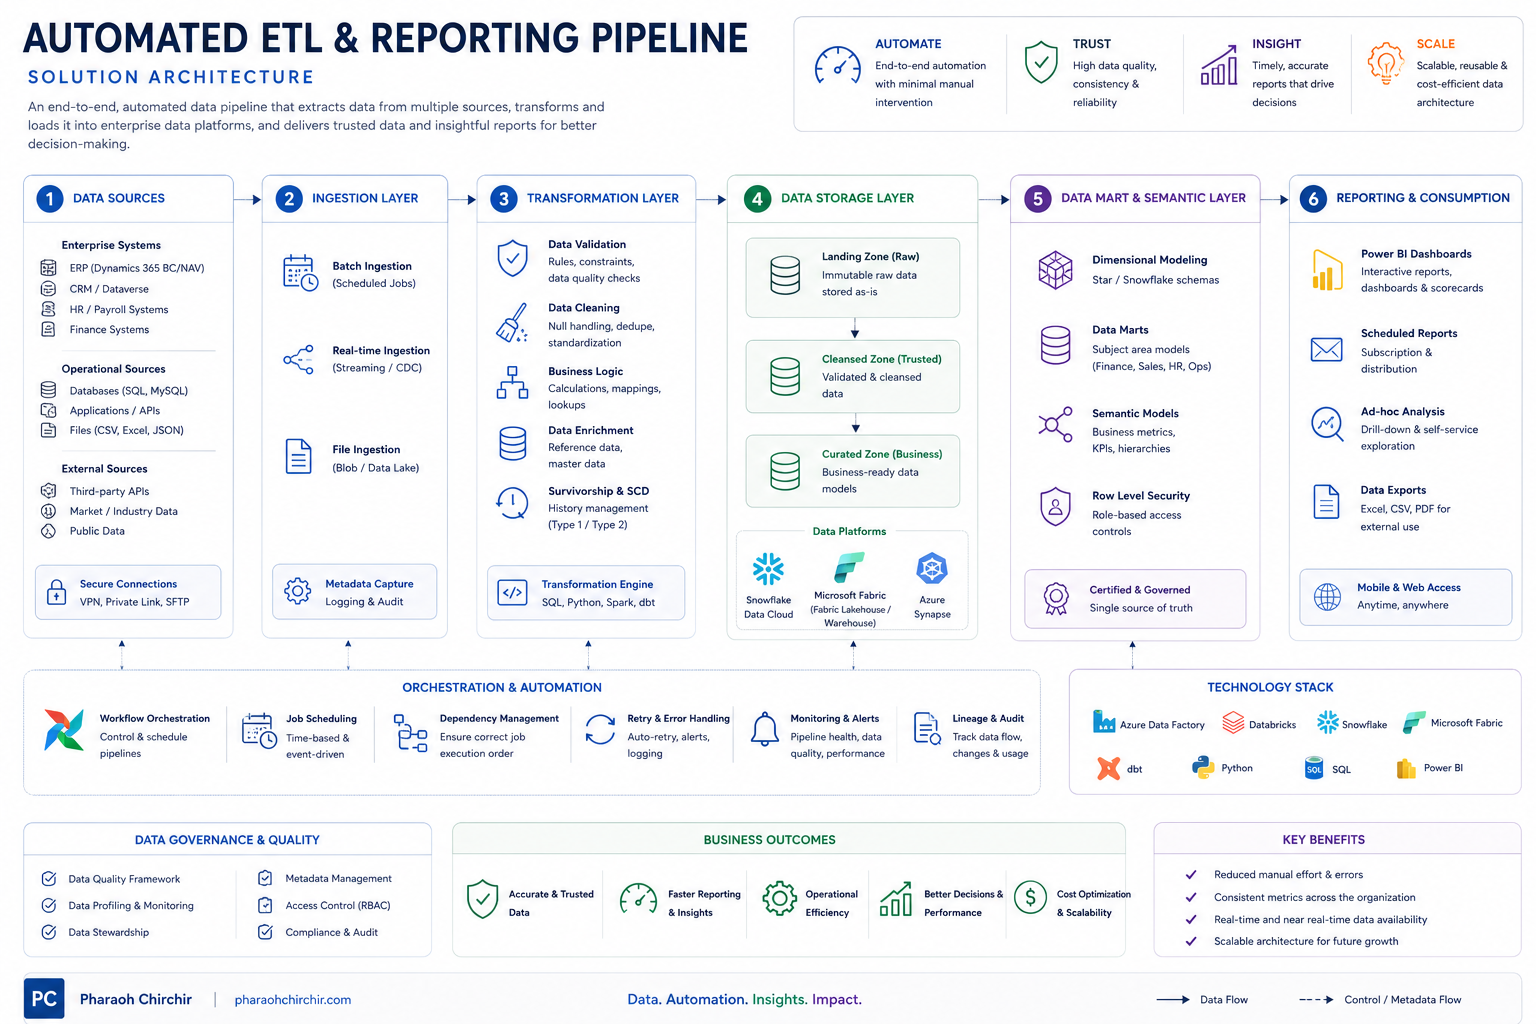
The architecture organizes the work into source systems, ingestion, transformation, data storage, semantic modelling and BI consumption. It also includes orchestration, monitoring, data governance and quality controls so the workflow is reliable enough for recurring reporting.
Architecture view: data sources, ingestion, transformation, storage, semantic layer, reporting consumption, orchestration and governance controls.
The Pipeline Logic
The pipeline begins by collecting data from enterprise, operational and external sources. Records pass through metadata capture and validation. Clean records continue into transformation, while exceptions are separated for review instead of silently entering the report.
The transformed layer then supports dimensional modelling, data marts, semantic models, row-level security and Power BI dashboards.
Where It Creates Value
For Finance, the pattern supports month-end consolidation and variance reporting. For operations, it supports KPI scorecards and SLA monitoring. For NGOs and programme teams, it supports recurring donor indicators and management packs.
The value is faster reporting, fewer manual errors, consistent data definitions and a stronger foundation for BI adoption.
Controls And Quality
The workflow includes validation rules, deduplication, missing-value checks, quarantine logic, dependency management, retry handling, lineage, audit trails and monitoring. These controls make the pipeline easier to trust and easier to explain to business users.
The Value In One Sentence
Automated ETL & Reporting Pipeline demonstrates how I turn recurring reporting work into a controlled data automation workflow with quality gates, reusable reporting marts and BI-ready outputs.