I built an explainable churn-scoring pipeline that identifies customers likely to leave, explains the risk drivers and converts model output into a retention action queue.
CSVTrain and score workflow for customer datasets.
CRMExport-ready retention queue for action planning.
RiskSegment and customer-level churn views.
The Retention Problem
Many teams have enough customer data to see churn risk earlier, but the signal is spread across tenure, billing, contract, service and support history. By the time the problem is visible in normal reporting, the customer may already be on the way out.
The goal was to demonstrate a practical predictive workflow where churn risk becomes an action queue, not just a model score.
The useful question is not only "who might churn?" It is "who should the team act on first, and why?"
The Challenge
A churn model can be technically strong and still fail business users if the output is difficult to trust. Retention teams need more than a probability. They need risk bands, customer ranking, key drivers, segment context and a way to export the next action list.
The case study therefore treats machine learning as one part of a wider analytics product: data preparation, scoring, interpretation, reporting and operational handoff.
The Product Question
I framed the work around one question:
Can customer data be transformed into a ranked, explainable retention workflow that a business team can actually use?
This shaped the pipeline around practical outputs: top customers likely to churn, segment risk, revenue exposure, driver explanation and CRM-ready export.
My Role
I designed the demo pipeline, prepared the sample modelling structure, built the scoring logic, created risk bands, shaped the Power BI-style dashboard views and connected the assistant responses to churn-focused questions.
This project shows how I translate predictive analytics into a business workflow that supports customer retention decisions.
Solution Architecture
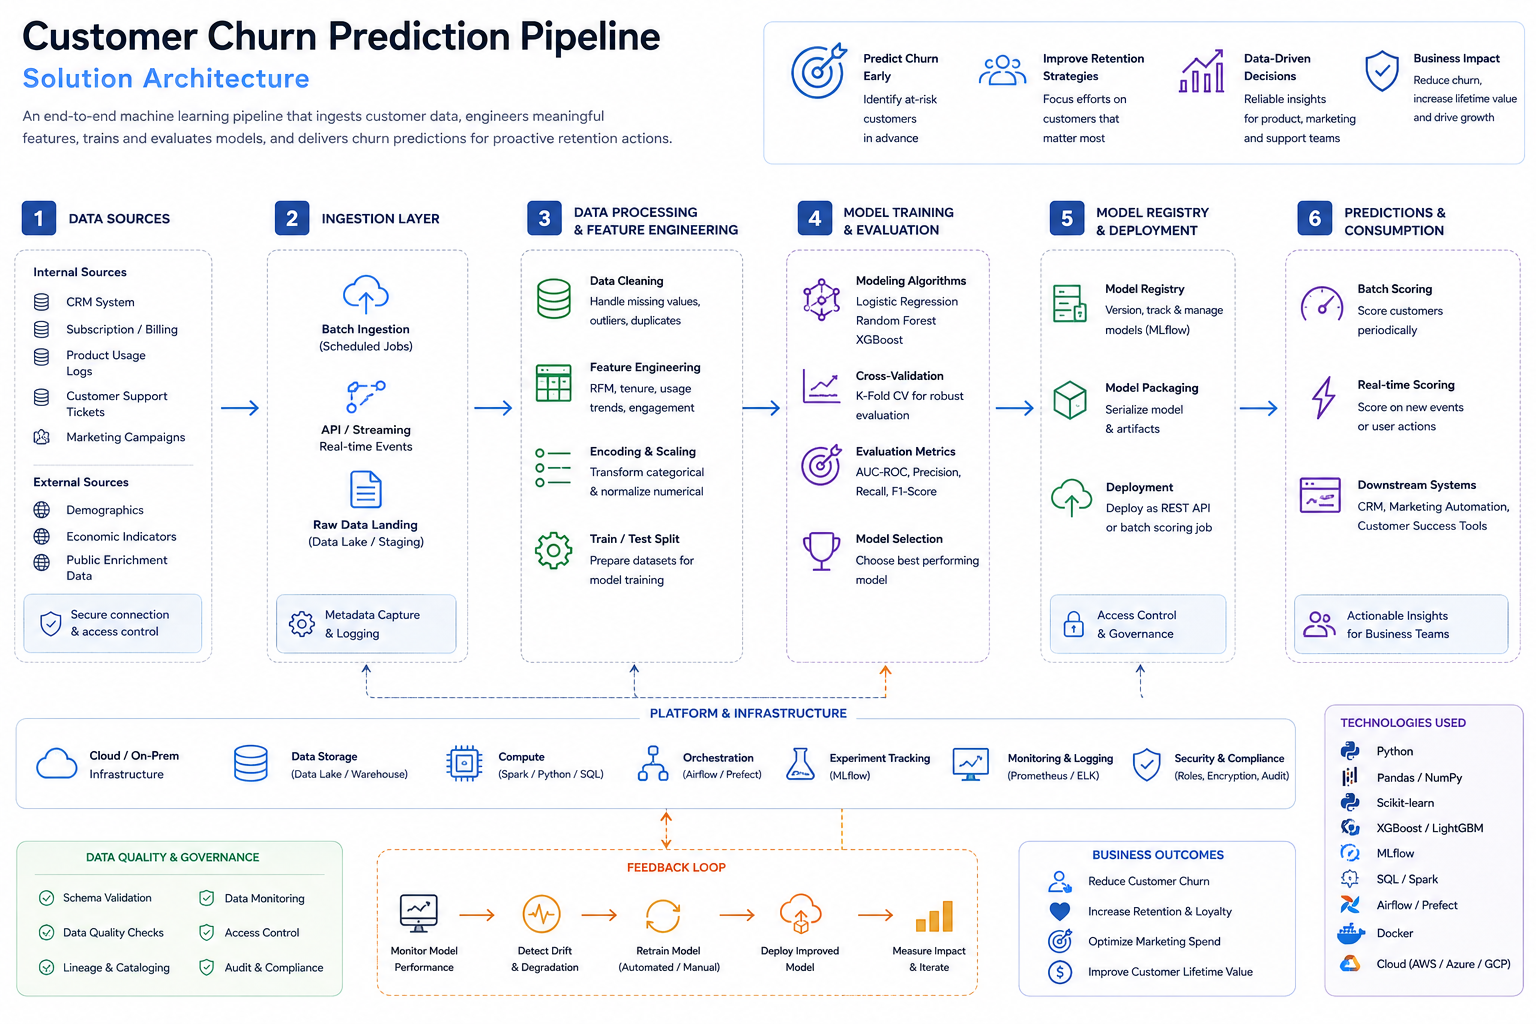
The architecture connects customer data, model scoring and retention operations in a simple pipeline that is easy to explain to technical and non-technical users.
Architecture view: customer data sources, ingestion, feature engineering, model training, registry, scoring, consumption and feedback loop.
Customer data
Prepare features Use tenure, billing, contract, service and support indicators.
Model-ready table Clean scoring structure for training and prediction.
Model layer
Train and score Estimate churn probability and classify customers into risk bands.
Churn score Customer-level probability and segment risk.
Explanation layer
Surface drivers Translate model factors into understandable risk reasons.
Business context Teams can see why a customer is flagged.
Decision layer
Rank action Combine risk, value and segment context into a retention queue.
Prioritized list Next customers likely to churn.
Export
Operational handoff Prepare output for CRM, outreach or manager review.
Retention action Model output becomes work the team can use.
Model Workflow
The sandbox supports a train-and-score pattern using CSV-ready customer data. Users can load sample data, run scoring and inspect how the model separates risk across the customer base.
The workflow emphasizes model outputs that can be validated visually: performance metrics, high-risk customers, segment risk, likely drivers and revenue exposure.
Scoring And Explanation
The score is translated into practical risk bands so that the dashboard does not depend on users interpreting raw probabilities. A high-risk customer becomes a retention candidate. Segment views help managers see whether risk is concentrated in specific customer groups.
The assistant layer supports churn-focused questions such as which customers are likely to churn next, what factors are driving risk and where retention teams should focus.
Use Cases
Retention Teams
Identify high-risk customers before cancellation and prioritize outreach.
Sales And Account Managers
Review value at risk and understand the customer segments that need attention.
Analytics Leaders
Show how predictive analytics can move from experimentation into repeatable business action.
Decisions Enabled
The pipeline helps users decide who to contact first, which customer segments need a retention strategy, which accounts carry the highest revenue exposure and which risk drivers need operational intervention.
This is the difference between a model and a decision product. The model estimates risk. The product helps a team act on it.
Demonstrated Result
The sandbox reports a demo ROC-AUC of 0.986 on the demonstration dataset. That metric is useful as a model-quality signal, but the stronger portfolio evidence is the complete workflow: scoring, explanation, segmentation, customer ranking and export-ready output.
What It Does Not Prove
This is a portfolio implementation using demonstration customer data. It does not claim production performance on a real company dataset, guaranteed retention lift or a validated commercial churn model.
Those claims would require production data, back-testing, lift analysis, campaign experimentation and monitoring after deployment.
Production Path
A production version would add data refresh, CRM integration, monitoring, drift checks, fairness review, model retraining rules, access control and campaign outcome tracking. The business case would then be measured through retention lift, revenue saved and cost of intervention.
Technology
Core skills: predictive analytics, feature preparation, classification, model evaluation, explainability, CRM analytics and dashboard design. Typical stack: Python, scikit-learn, XGBoost, CSV workflows, browser-based sandbox logic and Power BI-style reporting.
Evidence
The live demo shows the complete path from sample customer data to churn score, segment view, customer action queue and assistant explanation.