DataLens BI is a browser-based self-service analytics workspace I built to help business users inspect, clean and analyse CSV and Excel data before making decisions from it, without requiring every question to become a new BI-development request.
10Analytics workspaces from profiling through export.
8Cleaning operations with transformation logging.
RulesDeterministic statistics instead of black-box claims.
LocalBrowser-side CSV and Excel processing.
01
The Situation
A programme manager, finance lead or operations team may receive several Excel exports a few hours before a performance review. The files contain useful information, but nobody yet knows whether the data is complete, duplicated, correctly typed or ready for analysis.
The first business question is not what the dashboard shows. It is whether the data can be trusted enough to make a decision from it.
Can I trust this data enough to make a decision from it?
02
The Challenge
Everyday analytics still begins with spreadsheets: finance exports, HRIS extracts, service logs, field-collection files and CSV downloads from operational systems.
Users may analyse data before spotting missing values, duplicates or outliers.
Small exploratory questions become bottlenecks for central BI teams.
Uploading internal files to unknown online tools can introduce privacy concerns.
03
The Business Question
I framed the product around one practical question:
Can a business user move safely from raw file to quality assessment, cleaning, analysis, explanation and export in one guided workspace?
The goal was not to replace Power BI, enterprise warehouses or professional analysts. It was to solve the space between having a file and understanding what should happen next.
04
Why I Built It
In analytics work, stakeholders often begin with "Can you look at this Excel file?" Before a permanent reporting product is designed, an analyst needs to understand fields, completeness, duplicates, measures, trends, relationships and unusual values.
DataLens makes that exploratory stage easier to perform and easier to explain.
05
My Role
I designed and developed the platform end-to-end.
Product concept, user workflow and interface design.
CSV and Excel parsing, column-type detection and quality scoring.
Cleaning logic, audit logging, visualisation and export workflows.
Methodology, documentation, testing and synthetic demo-data design.
06
The Workflow Change
1
Open.
Load a CSV or Excel file directly in the browser.
2
Profile.
Understand columns, types, completeness, duplicates and outliers.
3
Clean.
Apply controlled transformations while preserving the raw source.
4
Analyse.
Explore distributions, segments, relationships and trends.
5
Export.
Download filtered data, cleaned data, pivot output or an analytical report.
07
The Analytical Pipeline
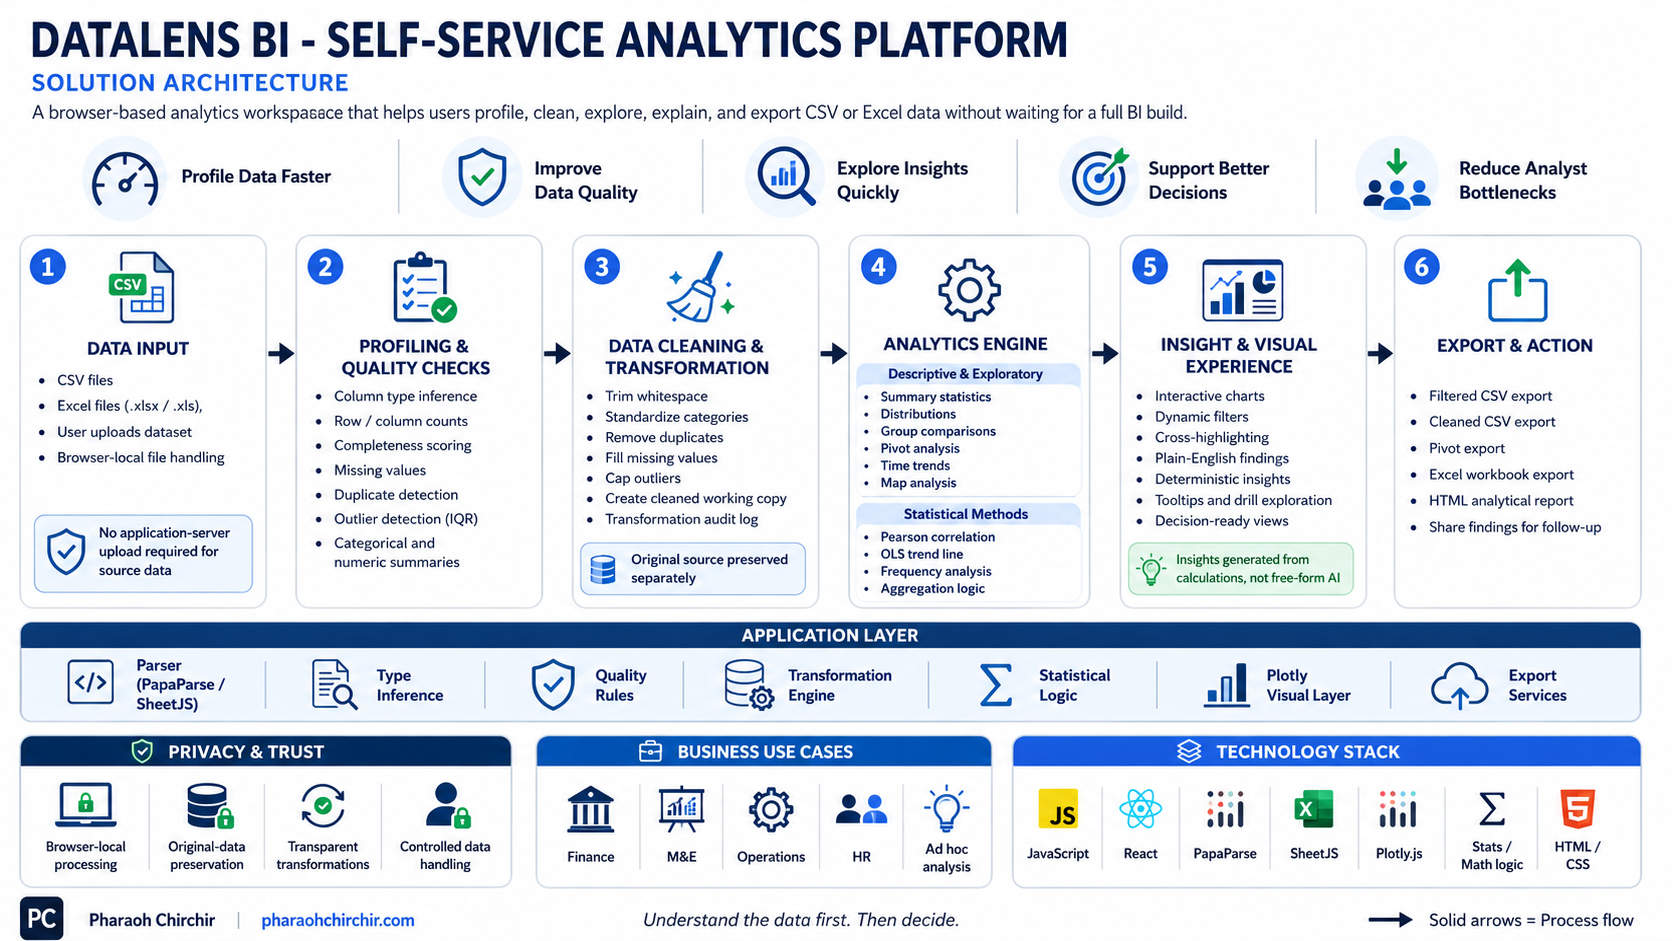
Architecture view: CSV and Excel input, profiling, quality checks, cleaning, analytics engine, visual experience and export workflow.
DataLens does not use machine learning just to sound intelligent. The analysis is built around transparent statistical methods so the same data and selections produce the same result.
Completeness from populated cells across the selected dataset.
Duplicate rows from full-row comparison.
Potential outliers using the Tukey IQR rule.
Pearson correlation for numeric relationships.
Ordinary least squares trend lines for scatter analysis.
09
Plain-English Insights
The insight layer converts calculated results into plain-language observations, such as revenue movement, highest average cost by segment or strongest positive relationship between selected measures.
Because these statements come from deterministic calculations, the explanatory layer remains reproducible and avoids unsupported AI-style conclusions.
10
Relatable Use Case
For a monthly programme review, a manager can check data quality, remove duplicate records, standardise formatting, filter by country, programme and month, then identify whether a delivery issue is concentrated in specific locations.
The meeting moves from "something looks wrong" to "this is where the issue is concentrated, this is the evidence, and this is the question we need to answer."
11
Practical Use Cases
Finance: investigate cost centres, duplicate transactions, unusual spend and high-variance business units.
M&E: test field-data completeness before donor reporting.
Operations: compare workload, cycle time, location and activity type.
HR: explore headcount, tenure, absence, attrition and salary distributions.
12
Product Boundaries
DataLens is not an enterprise data warehouse, governed semantic model, master-data platform, causal-inference engine, machine-learning platform or secure document-management system.
I designed it for rapid exploratory analytics on local files. Recurring logic should still move into governed datasets, semantic models and controlled BI products.
13
Privacy By Design
The public version processes the selected CSV or Excel file inside the user's browser. The source file is not uploaded to an application server for processing.
This reduces server-side data exposure, while still requiring each organisation to follow its own information-security, classification and data-handling controls.
8 cleaning operations for common data-preparation problems.
CSV, XLSX and XLS support.
Filter-aware analysis across the workspace.
Original-data preservation through a separate working copy.
15
Why It Matters
A dashboard assumes the data has already been prepared. DataLens starts earlier and demonstrates the analytical thought process: understand the data, test quality, prepare it, explore patterns, explain the pattern and decide what deeper work is required.
16
Technical Architecture
PapaParse / SheetJS↓Type inference↓Cleaning audit log↓Correlation and trend analysis↓Plotly.js visuals↓CSV / Excel / HTML export
17
What I Would Measure Next
File-load time by dataset size.
Analysis latency and cleaning-operation execution time.
Browser-memory behaviour.
Accuracy of automatic type inference.
Task-completion time for first-time users.
18
Production Path
An enterprise version would add authenticated users, organisation workspaces, governed dataset connections, saved sessions, role-based permissions, audit logs, reusable transformation recipes, telemetry, monitoring and integration with Power BI or enterprise semantic models.
19
What I Learned
Data quality belongs before visualisation.
Not every analytical question needs AI.
Self-service analytics still needs governance.
Exploration and enterprise BI solve different problems.
20
Product Value And Evidence
DataLens BI helps users turn unfamiliar spreadsheets into understandable analytical evidence before committing time to a full reporting or data-engineering solution.