I built a Power BI-style risk analytics dashboard that turns synthetic seismic event records into a clear operational view of magnitude, depth, exposure, region and risk concentration.
39Synthetic seismic events available in the current demo dataset.
MapRegional event pins showing risk and magnitude patterns.
FiltersDate, region, risk, magnitude and depth slicers.
CSVFiltered event register can be exported for review.
The Risk Problem
Risk events become useful only when decision-makers can see where they happened, how severe they were, what exposure they created and which areas require attention. A spreadsheet of seismic events can hold all of that information, but it does not naturally show operational priority.
The dashboard was created to show how raw event records can become a risk intelligence product for teams that need to inspect patterns quickly.
The value is not predicting earthquakes. The value is helping teams understand current risk patterns from event data.
The Challenge
The challenge was to make a technical dataset readable in seconds. Users should be able to filter by time, region, risk level, magnitude and depth, then see the KPIs, charts, map pins and register update together.
The demo also needed to feel like a business dashboard rather than a collection of disconnected charts. Each visual therefore supports one of three questions: where is the risk concentrated, what is driving the risk and which events should be reviewed first?
The Product Question
I framed the dashboard around one question:
Can seismic event records be transformed into a compact operational risk view that supports filtering, review and export?
This shaped the report around slicers, KPI cards, map behaviour, risk split, trend visuals and an event register rather than long explanatory text.
My Role
I designed the synthetic dataset pattern, risk fields, dashboard layout, filtering behaviour, KPI cards, geospatial view, chart interactions and export workflow. The project demonstrates data analytics, report design and operational dashboard thinking.
Solution Architecture
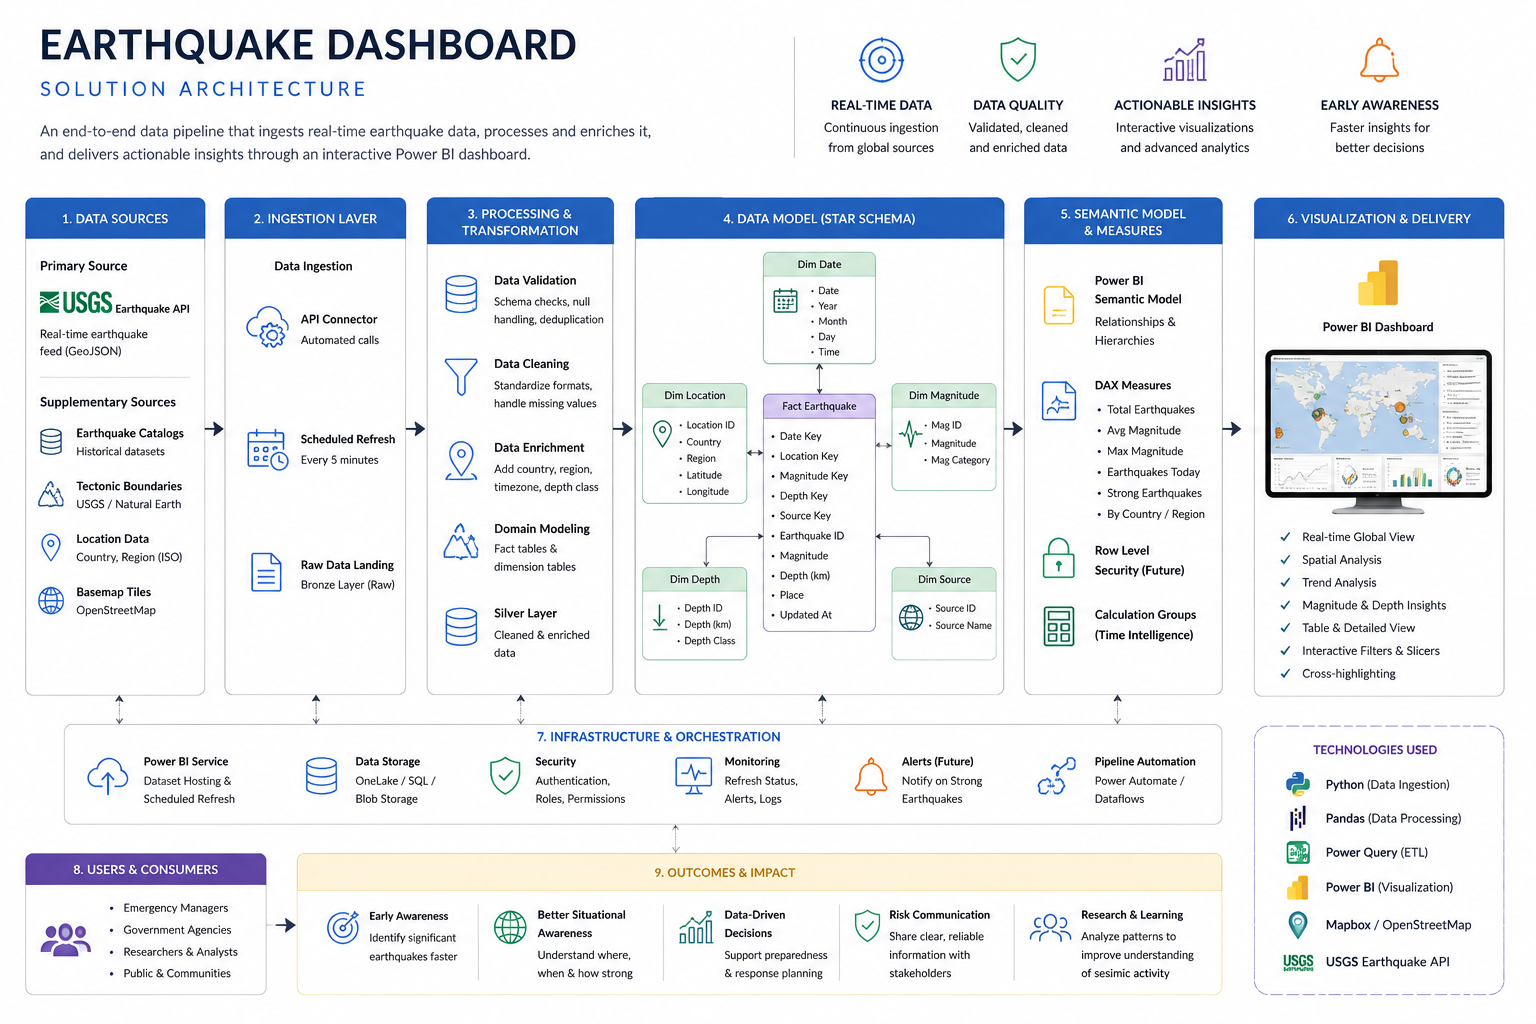
The solution follows a simple analytics flow: create a structured event dataset, enrich it with risk fields, let users filter it, then update every visual from the same filtered context.
Architecture view: earthquake API source, ingestion, enrichment, star-schema model, semantic measures, Power BI-style dashboard and impact outcomes.
Event dataset
Prepare records Capture date, region, magnitude, depth, coordinates, risk band and exposure.
Structured data Clean event table ready for dashboard analysis.
Risk logic
Calculate priority Combine magnitude, depth and exposure into risk views.
Risk bands High, moderate and low event classifications.
Slicers
Filter the model Date range, region, risk level, minimum magnitude and maximum depth.
Selected context Every KPI and visual updates together.
Visual layer
Show the pattern Map pins, risk split, trend, KPI cards and event register.
Operational view Users can see where risk is concentrated.
Action output
Export and review Keep the filtered event table available for CSV export.
Review pack Selected events can move into follow-up analysis.
Dashboard Experience
The report opens with slicers on the left and a Power BI-style visual canvas on the right. Users can adjust the date range, region, risk level, magnitude threshold and depth range. The KPI cards then update alongside the map, risk split and event register.
This creates a fast inspection path: filter, scan KPIs, inspect location patterns, review the event table and export if needed.
Analytical Logic
The current demo uses a synthetic seismic operations dataset. The risk view combines event magnitude, depth profile, region and exposure pattern to show which events deserve priority review.
The logic is intentionally simple enough for a portfolio visitor to understand while still demonstrating the structure of a decision dashboard.
Decisions Enabled
The dashboard helps users identify where high-risk events cluster, which regions carry greater exposure, how the selected event pattern changes over time and which records should be reviewed or exported.
For an operations, logistics, security or humanitarian team, the same pattern could support emergency readiness, route planning, site exposure review and incident monitoring.
Use Cases
Operational Risk
Monitor event concentration across regions and identify areas requiring escalation or preparedness review.
Humanitarian And Logistics Planning
Use map-based risk views to understand where movement, field activity or site access may require additional attention.
Facilities And Security
Review exposed sites or assets and export filtered event registers for follow-up.
What The Project Demonstrates
The project demonstrates data modelling, filter-driven interactivity, geospatial visualization, KPI design, export handling and dashboard storytelling. It also shows how a technical dataset can be turned into a clear management interface.
What It Does Not Prove
This is not an official hazard-monitoring system, earthquake prediction model or emergency alerting product. It uses a synthetic dataset for demonstration and should not be interpreted as live public-safety intelligence.
Production Path
A production version would connect to official event sources, add live data refresh, stronger geospatial layers, role-based access, alerting rules, validation checks, audit logs and incident-management integration.
Technology
Core skills: data analytics, dashboard design, geospatial analytics, risk scoring, filter logic, KPI modelling and export workflows. Implementation: browser-based Power BI-style dashboard, map layer, synthetic event data, interactive slicers, charts and CSV export.
Evidence
The live dashboard lets visitors interact with the dataset directly: filter the event records, inspect the map and export the selected register.