I built a transaction risk analytics workflow that scores suspicious activity, explains why a transaction is flagged and turns model output into an investigation queue.
96%Demo detection-rate pattern in the scanner story.
0.4%False-positive pattern used for review tradeoff.
50KTransactions-per-day simulation pattern.
20msInference-latency target in the demo narrative.
The Fraud Operations Problem
Fraud teams need to review suspicious activity quickly, but high-volume transaction data creates a practical problem: too many records, too many weak alerts and too little time to identify the cases that matter.
The goal was to show how anomaly detection and rule-based explanation can support triage without hiding the reason behind a risk score.
A useful fraud model should not only flag risk. It should help an investigator understand why the case deserves attention.
The Challenge
Fraud detection lives in a tradeoff: missing real fraud is costly, but sending too many normal transactions to review slows operations and damages customer experience. The dashboard therefore needs to make score, reason, exposure and queue priority visible together.
I designed the demo around a review workflow: score transactions, explain risk reasons, estimate exposure, prioritize the queue and support investigation decisions.
The Product Question
I framed the project around one question:
Can transaction data become a ranked investigation queue that is fast, explainable and useful to a fraud team?
This shaped the product around anomaly scoring, risk indicators, investigation state and exportable review evidence.
My Role
I designed the transaction risk workflow, synthetic data pattern, scoring narrative, dashboard layout, risk-reason logic, investigation queue and sandbox interface. The project demonstrates machine-learning thinking, risk analytics and operational dashboard design.
Solution Architecture
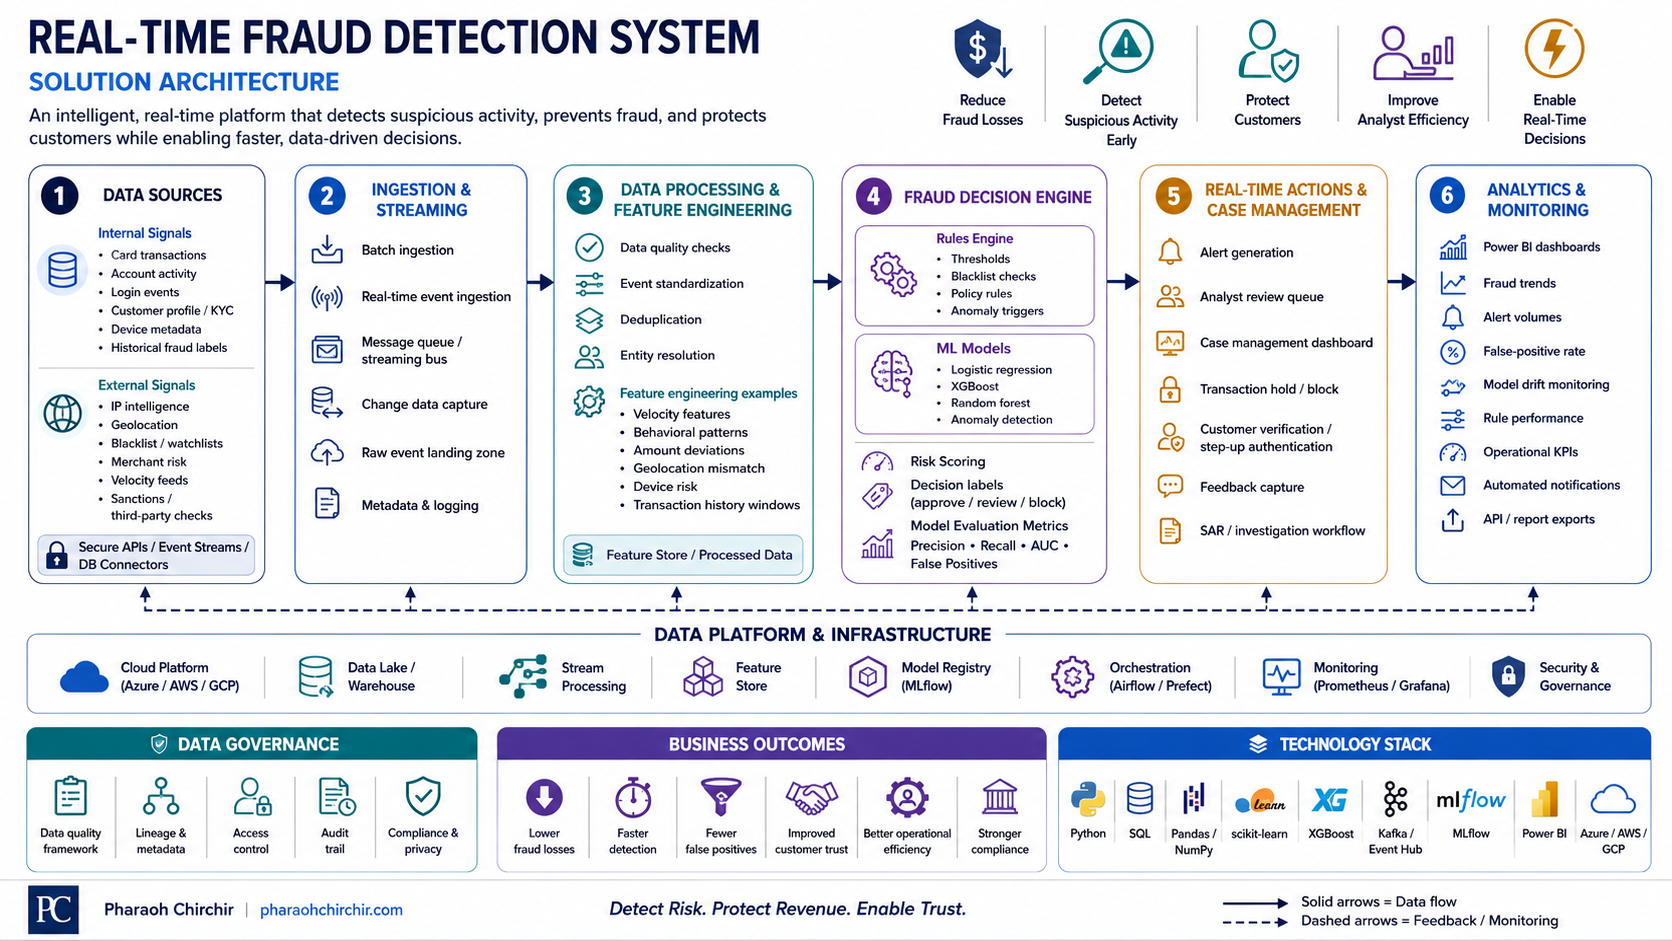
The architecture connects transaction signals to risk scoring and investigation action.
Architecture view: fraud signals, streaming ingestion, feature engineering, decision engine, case management, analytics and governance.
Transactions
Capture activity Use amount, channel, location, merchant, time and behavioural signals.
Risk-ready input Transaction records prepared for scoring.
Feature layer
Enrich context Compare activity against expected behaviour and risk patterns.
Risk signals Unusual amount, velocity, location or channel indicators.
Scoring
Classify risk Combine anomaly score and business rules into a review priority.
Risk band Normal, watch, high risk or critical.
Explanation
Show reason Surface the triggers behind the score so investigators can verify the case.
Review context Risk is explainable, not just a number.
Queue
Prioritize action Rank cases by risk, exposure and urgency.
Investigation list Teams know what to review first.
Use Cases
Digital Payments
Flag unusual transactions before loss or settlement exposure increases.
Insurance Claims
Score incoming claims against behavioural and historical patterns to prioritize review.
Banking And Microfinance
Identify account takeover, unusual transfer velocity or location mismatches for investigation.
Decisions Enabled
The workflow helps fraud teams decide which transactions to review first, which risk driver triggered the case, what exposure is associated with it and whether the queue is becoming too noisy.
It also shows how model outputs can support an investigation workflow instead of sitting as isolated scores.
What It Does Not Prove
This is a portfolio demo using synthetic transaction patterns. It does not claim certified fraud detection performance, production latency, regulatory approval or guaranteed loss reduction.
Those claims would require real transaction history, labelled fraud outcomes, back-testing, model monitoring, security review and production incident handling.
Technology
Core skills: anomaly detection, risk scoring, investigation workflow design, dashboard UX, model interpretation and operational analytics. Typical stack: Python analytics patterns, FastAPI-style service thinking, browser-based sandbox logic and Power BI-style visual reporting.
Evidence
The live demo lets visitors score synthetic transactions, inspect risk reasons and review the investigation queue.