I developed a regional BI operating model that brought enterprise finance, CRM and operational reporting into governed analytical workflows, reducing recurring report-preparation effort by approximately 75% and improving management visibility across 12+ countries in Africa and the Middle East.
12+Countries supported through the regional analytics environment.
75%Approximate reduction in recurring report-preparation effort.
20+Analysts and business users enabled through Power BI and SQL training.
40%Estimated reduction in recurring BI support demand after enablement.
01
The Situation
Regional management needed to understand performance across multiple countries, business units and operating environments. The information existed, but it was distributed across enterprise systems, operational sources and recurring country-level reporting processes.
Finance, Operations and regional management frequently needed the same underlying data presented in different ways for monthly reviews, forecasts, operational performance discussions and management reporting.
02
The Challenge
The challenge was not simply producing another dashboard. It was creating a reporting environment where leadership could trust that the numbers meant the same thing across countries and where analysts no longer had to rebuild recurring logic every reporting cycle.
Speed: analysts spent too much time preparing reports.
Trust: inconsistent definitions created reconciliation questions during reviews.
Scalability: new countries, KPIs or requirements increased effort instead of reusing a common foundation.
How could regional leadership work from one governed view of financial and operational performance without repeated manual country-level consolidation?
03
My Role
Role: Senior Regional Data Analyst.
Gathered requirements with Finance, Operations and management.
Mapped source systems and validated reporting grain.
I designed semantic models, KPI definitions, DAX measures and Power Query / SQL transformation logic.
Supported Dynamics 365 Business Central, CRM / Dataverse and operational analytics integration.
Managed documentation, SOPs, UAT, deployment controls, analyst training and enhancement review.
04
The Operating Model Change
Before
Country systems and files↓Manual extraction and preparation↓Country-specific calculations↓Spreadsheet reconciliation↓Regional management pack with definition questions
After
Enterprise and operational sources↓Controlled transformation and validation↓Reusable analytical datasets↓Governed semantic model↓Power BI reporting, drill-down and exception ownership
05
The Approach
1
Understand the decision process.
I started from management questions: performance against budget, variance drivers, operational KPIs, exceptions and where to drill before month-end decisions.
2
Map and validate sources.
I checked source grain, country identifiers, date logic, currency context, duplicates, missing records, mapping tables and KPI ownership.
3
Standardise the model.
I moved recurring transformations and calculations into reusable analytical layers designed around management-review entities.
4
Govern the semantic layer.
I created reusable measures for actuals, budget, forecast, variance, MTD, YTD, prior period, KPI performance and exceptions.
5
Build for investigation.
The reporting path allowed users to move from region to country, business unit, KPI and exception.
06
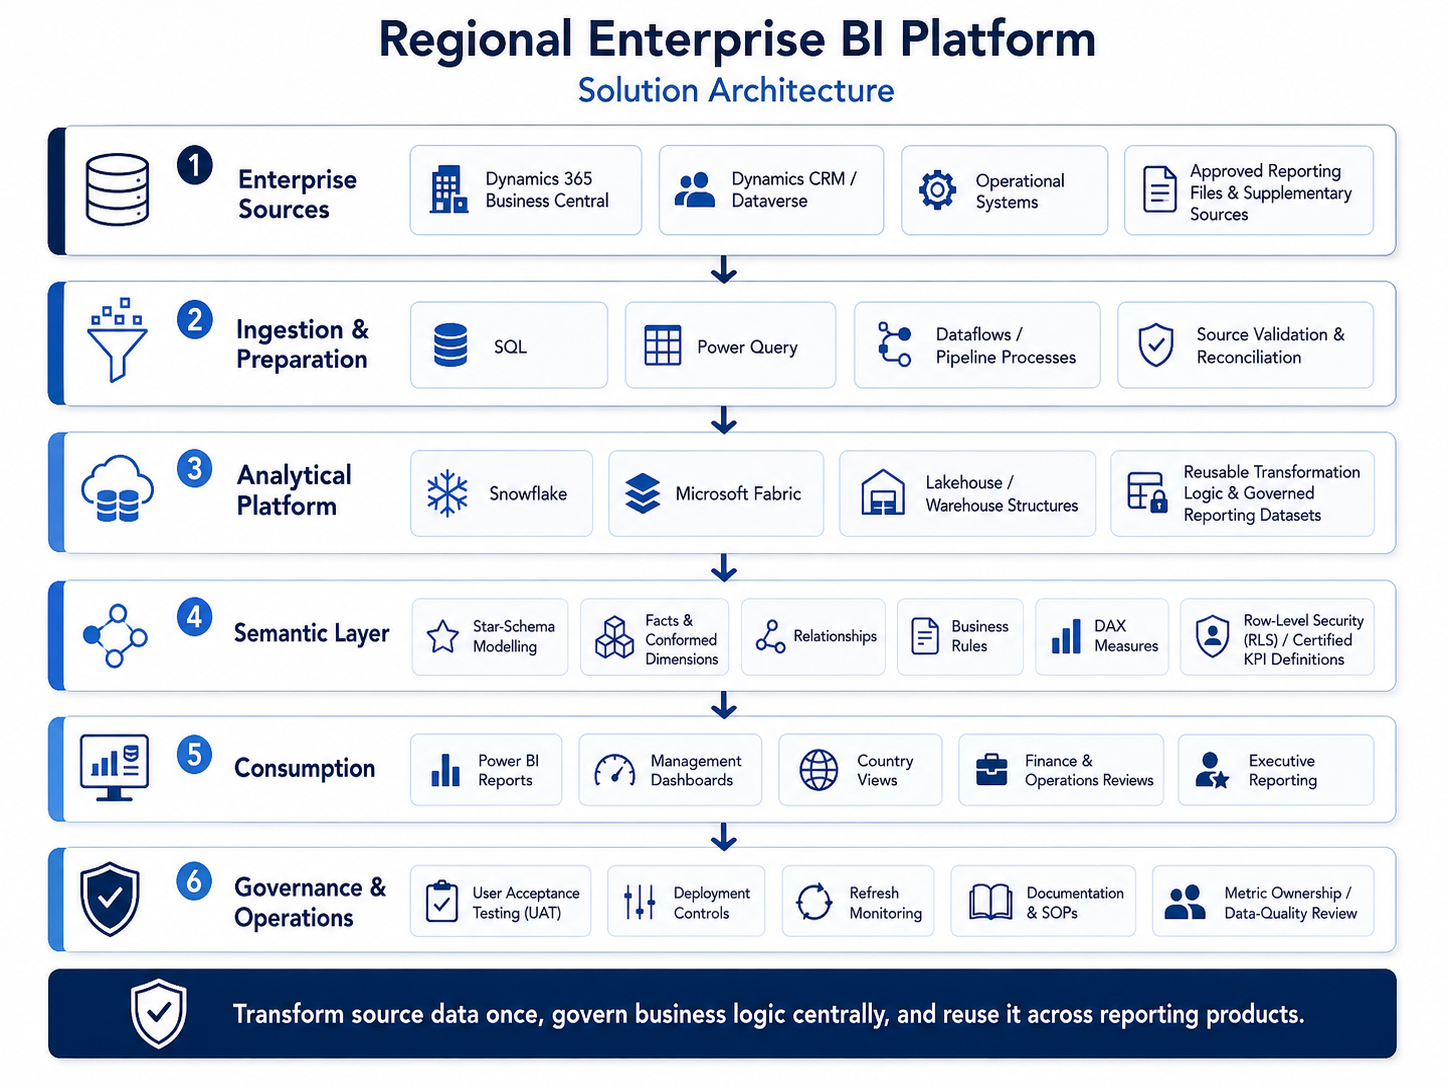
Solution Architecture
Architecture view: enterprise sources, ingestion, analytical platform, semantic layer, Power BI consumption, governance and operations controls.
Dynamics 365 Business Central, Dynamics CRM / Dataverse, operational systems and approved reporting files↓SQL, Power Query, dataflows, pipeline processes and source validation↓Snowflake and Microsoft Fabric analytical patterns with reusable transformation logic↓Star-schema semantic layer, DAX measures, RLS and certified KPI definitions↓Power BI reports, management dashboards, country views and executive reporting
Transform source data once, govern business logic centrally, and reuse it across reporting products.
07
The Semantic Model
The semantic model separated business reporting logic from individual dashboard pages. Instead of every report maintaining its own calculations, reusable measures and relationships provided a common definition of performance.
Facts represented measurable activity such as actuals, budgets, forecasts and operational events.
Dimensions represented management context: date, country, business unit, customer, contract and reporting classifications.
DAX measures represented governed calculations rather than hidden visual-level logic.
RLS and workspace permissions supported controlled consumption.
08
What I Built
Regional performance reporting: country and business-unit comparison using consistent KPI definitions.
Budget and forecast monitoring: inspection of actuals against budget and forecast with variance drivers.
Exception analysis: source and business-rule exceptions surfaced for investigation.
Country drill-down: regional indicators investigated at country and operational level.
Repeatable reporting: transformations and measures reused across reporting cycles.
09
Key Use Cases
Regional monthly review: leadership compares country performance, budget movement and operating indicators from a consistent regional picture.
Finance variance investigation: Finance drills into country, business unit and reporting categories to explain movement.
Operational review: Operations identifies where KPIs are moving away from target.
Country performance review: country teams inspect the same measures reviewed regionally.
Reporting-quality control: BI and Analytics identify records that do not meet reporting conditions.
10
What The Analysis Changed
The reporting process shifted from collecting, transforming, reconciling and formatting information toward explaining performance, investigating variance, discussing operational causes, assigning follow-up and improving KPI definitions.
The BI environment became more than a presentation layer. It became part of the regional management process.
11
Governance And Controls
Data trust: agreed KPI definitions, reconciliation checks, exception monitoring and documented business rules.
Security: workspace permissions, role-based access, RLS where required and least-privilege access.
Release management: Development, UAT and Production separation with controlled deployment.
Monitoring: refresh monitoring, failed-refresh investigation, variance checks and recurring-issue review.
Documentation: business logic, known limitations, support procedures and SOPs.
12
Adoption And Enablement
Technology was only part of the delivery. I supported adoption through Power BI training, SQL/MySQL training, reporting standards, reusable analytical practices, documentation, user support and recurring management-review routines.
More than 20 analysts and business users were trained, contributing to an estimated 40% reduction in recurring BI support demand.
13
Results And Impact
Reporting preparation: recurring transformations, calculations and reporting logic moved into reusable analytical workflows, reducing recurring report-preparation effort by approximately 75%.
Regional visibility: leadership gained a consistent analytical view across 12+ countries in Africa and the Middle East.
User enablement: training and standardisation strengthened self-service capability and reduced recurring support dependency.
Budget visibility: the environment supported management visibility into budget and forecast performance, including periods where the region tracked around 98% budget attainment. The analytics provided visibility into the result and should not be interpreted as the sole cause of the outcome.
14
What Made It Difficult
Different data grains: finance, CRM and operations represented business activity differently.
KPI consistency: regional KPIs only became useful when countries interpreted them consistently.
Trust and adoption: users needed confidence that reporting reconciled with source systems they already understood.
15
What I Learned
Start with the decision, not the visual.
Governance belongs inside BI development, not after it.
The semantic model is an organisational asset.
Adoption is part of delivery: training, documentation and routines determine whether analytics becomes how the business operates.
16
Public Portfolio Reconstruction
The operational data used by the organisation is confidential and is not reproduced publicly. I use synthetic and abstracted data here to demonstrate enterprise-source integration, warehouse and transformation flow, star-schema modelling, semantic relationships, interactive filtering, management KPIs and production-readiness controls.
17
Production Readiness
Security: Microsoft Entra roles, workspace permissions, RLS and least-privilege access.
Data governance: certified metric definitions, source lineage, owner approval and data-quality thresholds.
Monitoring: refresh alerts, anomaly and variance checks, issue ownership and release notes.
Adoption: analyst training, executive-review routines and controlled metric-change process.
18
Technology Used
Power BIDAXPower QuerySnowflakeMicrosoft FabricSQLDynamics 365 Business CentralCRM / DataverseSemantic ModelsStar SchemaRLSDev / UAT / ProductionConfluenceSOPs
19
Evidence
The business value in one sentence: the platform shifted regional reporting from repeated data preparation toward governed, reusable analytics that gave leadership more time to discuss performance, exceptions and action.