A Power BI-style decision product I designed to connect workforce, financial and operational data so leaders can see where staffing decisions protect margin, where they create cost pressure and what action should come next.
1,800Synthetic employees across frontline and support roles.
85Client sites across Kenya, Uganda, Rwanda, Tanzania and Zambia.
18Months of workforce, demand and contract finance history.
6Drivers combined into a Workforce Pressure Score.
The Business Problem
Traditional HR dashboards show headcount, turnover and absence. That helps HR, but it does not fully answer the executive question: what is the workforce doing to cost, coverage, productivity, client revenue and margin?
The real issue appears when HR, Finance and Operations data are separated. A site can look fully staffed but still miss service coverage because the wrong skills are available. Another site can protect service levels by using overtime, but quietly damage margin.
The dashboard turns workforce management into an economics question, not only an HR reporting question.
What I Built
I created a synthetic enterprise model for a fictional field-services organization operating across five countries and 85 client sites. The model joins HR master data, attendance, scheduling, absence, overtime, site demand, required staffing, payroll cost, client revenue, labour budget and SLA penalties.
I built a three-page executive report covering workforce economics, capacity pressure and decision actions. I designed it for CFO, CHRO and COO review, so leaders can see the cost and operational effect of staffing decisions in one place.
Solution Architecture
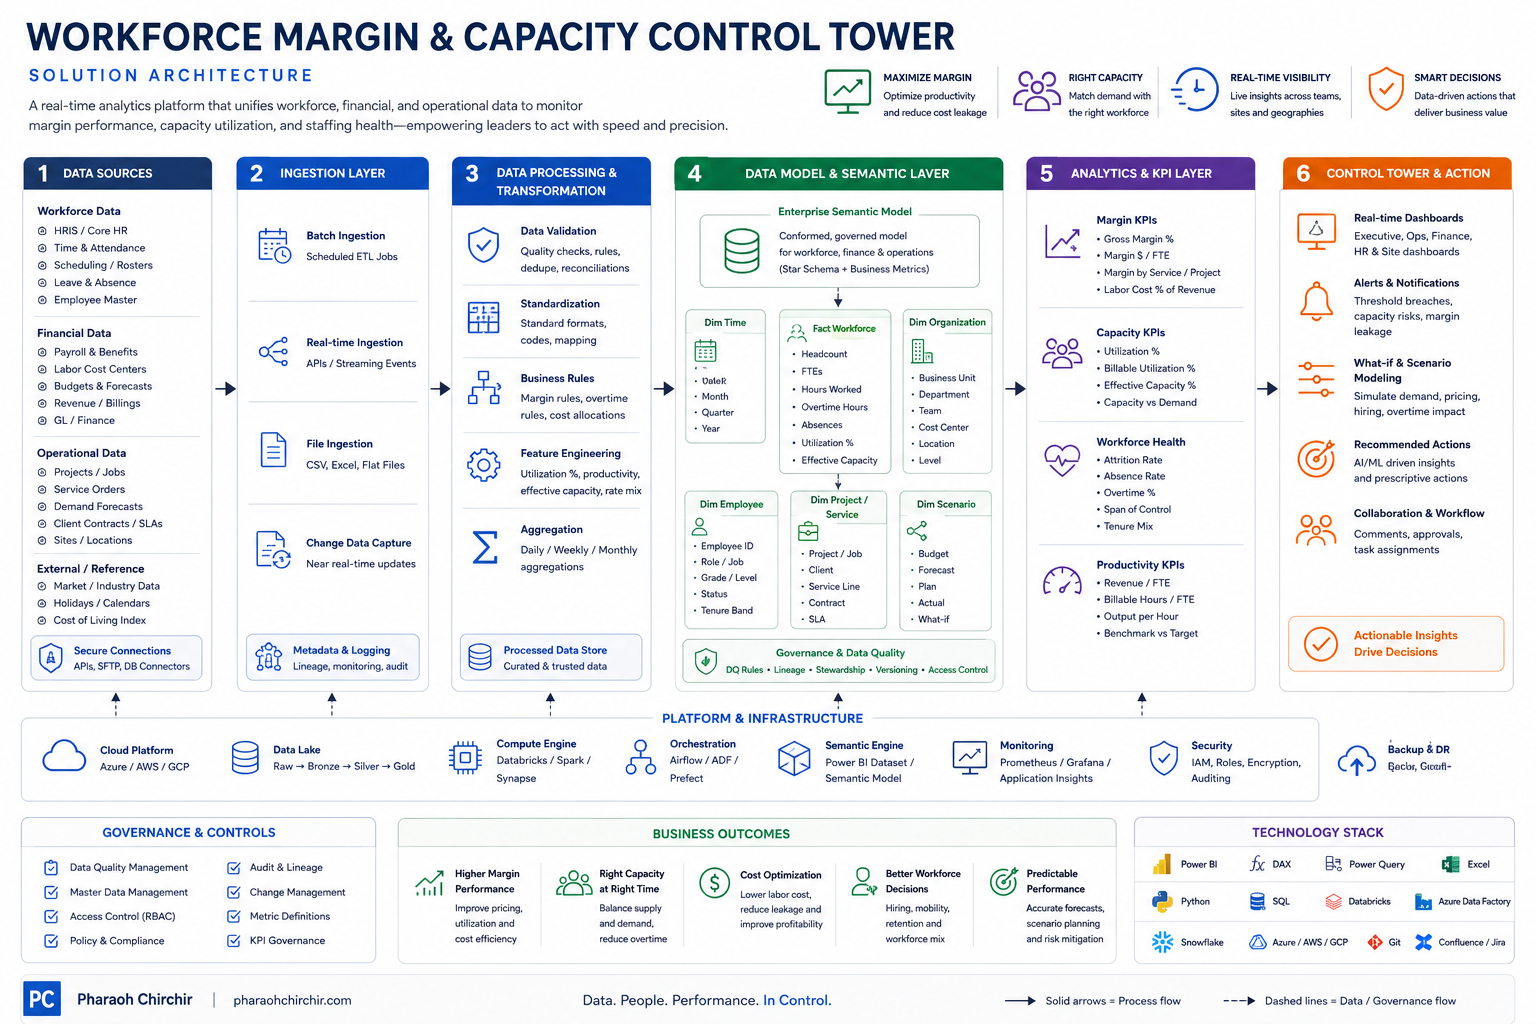
The architecture starts with workforce, finance, operational and reference data, then moves through ingestion, transformation, semantic modelling, KPI logic and a control-tower layer that supports dashboards, alerts, what-if scenarios and recommended actions.
Architecture view: workforce, finance and operations sources feeding a governed semantic model, KPI layer and executive control tower.
The Data Model
The model is star-schema-ready. It uses Date, Employee and Site dimensions connected to daily workforce activity, workforce demand and monthly contract finance. This supports clean slicing by country, region, client, site, business unit, role, grade and period.
The grain is deliberately practical: daily workforce activity explains hours, absence, overtime and productivity; demand explains required capacity; contract finance explains revenue, labour budget, payroll cost, benefits and penalties.
The Analytical Logic
The report calculates Workforce Cost, Labour Cost % Revenue, Labour Margin, Budget Variance, Capacity Gap, Coverage %, Productive Hours %, Overtime Dependency and Cost per Productive Hour.
The Workforce Pressure Score combines coverage, vacancy rate, overtime dependency, absence, skill coverage and budget variance. Sites are classified as Healthy, Watch, High Risk or Critical, making the dashboard easier to act on than a collection of disconnected KPIs.
Business Patterns In The Data
The synthetic dataset is not random. It includes prolonged vacancies that drive overtime and margin erosion, high absence that increases replacement cost, adequate headcount with weak skill coverage, excess capacity after demand declines and a business unit that improves after targeted hiring.
Key Decisions Enabled
The control tower helps management decide where workforce costs are damaging margin, where staffing capacity fails to meet demand, what is causing the problem, what action should be taken and what financial effect that action is likely to create.
The decision centre ranks interventions by estimated impact and includes a hiring what-if simulation that compares recruitment cost, payroll increase, overtime reduction, net annual financial impact and break-even month.
Power BI Techniques Demonstrated
The project demonstrates star-schema modelling, DAX measures, dynamic titles, slicers, conditional formatting, drill-through, report-page tooltips, a what-if parameter, ranked intervention tables, dynamic commentary and executive-style dashboard design.
The Value In One Sentence
Workforce Margin & Capacity Control Tower demonstrates how I connect HR, Finance and Operations data into a decision product that helps leaders protect margin, match capacity to demand and act on the highest-value workforce interventions.